If you're spending money on ads but struggling to make sense of the data, you're not alone. Mastering digital marketing analytics is the key to turning raw numbers into real profit. Many businesses face a "Decision Gap"—they collect massive amounts of data but only use a fraction of it for decision-making. According to the CMO Survey, companies use just 31.6% of their available data, leaving significant growth on the table.
This guide is designed to close that gap for good. At its core, digital marketing analytics is the process of analyzing campaign performance and customer behavior to understand what's truly working so you can do more of it. It's the science of turning clicks into cash.
By the end of this guide, you will have a repeatable framework to:
- Build a successful analytics strategy from the ground up.
- Identify the 10+ essential metrics you must track (and which to ignore).
- Choose the right advanced attribution model for your business.
- Implement a privacy-first analytics strategy for the cookieless era.
Let's turn your data into your biggest competitive advantage.
Why Digital Marketing Analytics is Your Most Valuable Asset
Ever feel like you're just throwing money at Facebook and hoping for the best? That's what happens when you ignore your data. The cost isn't just missed opportunities; it's wasted ad spend, confused customers, and competitors who are eating your lunch because they know their numbers.
While a Salesforce report shows that 88% of marketers use analytics tools, the massive "Decision Gap" proves that having data isn't the same as understanding it. This is where digital marketing analytics becomes your secret weapon. It connects data to decisions and helps you:
- Optimize ROI: Stop guessing which ads work. Data tells you exactly where to put your money for better returns.
- Understand Your Customers: Go beyond demographics. Analytics reveals what your audience actually wants, how they find you, and what makes them click "buy."
- Make Smarter Budget Allocations: Confidently shift your budget from underperforming channels to a campaign that's absolutely crushing it. No more emotional decisions, just profitable ones.
In 2026, the brands that win will be the ones that can turn data into decisions faster and more accurately than anyone else.
The ACTION Framework: A Simple Model for Analytics Success
Feeling overwhelmed? We've broken down the entire analytics process into a simple, memorable framework. Just follow these steps.
The ACTION Framework:
- A - Aggregate: Pull all your data into one place—Meta Ads, Google Ads, Shopify, Google Analytics, TikTok. You can't see the whole picture if you're only looking at one piece. An analytics platform is essential here.
- C - Contextualize: Numbers without context are just noise. A 2% conversion rate is fantastic for one industry and terrible for another. Context is about understanding what the numbers mean for your specific business and goals.
- T - Track: You can't manage what you don't measure. This step is about identifying the key metrics that actually impact your bottom line and ignoring vanity metrics.
- I - Interpret: This is where the magic happens. Interpretation is about connecting the dots. Why did sales spike on Tuesday? Why is one ad's CTR double the others? Here, we apply attribution models to understand what's really driving results.
- O - Optimize: Data is useless if you don't act on it. Based on your interpretation, it's time to make changes: scale a winning ad set, pause a loser, or reallocate your budget.
- N - Next Steps: Analytics isn't a one-and-done task; it's a continuous loop. After you optimize, you go back to the beginning, aggregate the new data, and start the process all over again.
The Ultimate Digital Marketing Metrics Breakdown
Here are the essential metrics you need to track, broken down by category to help you focus on what matters at each stage of the funnel.
Channel Performance Metrics
These metrics tell you if people are paying attention to your ads.
1. Click-Through Rate (CTR):
- Definition: The percentage of people who saw your ad and clicked on it.
- Why It Matters: It's the first indicator of whether your creative and copy are resonating. A low CTR often means your ad is irrelevant.
- How to Measure: (Total Clicks / Total Impressions) x 100.
2. Cost Per Click (CPC):
- Definition: The average amount you pay for each click on your ad.
- Why It Matters: It directly impacts your budget efficiency. A high CPC can drain your ad spend before you get a chance to make a sale.
- How to Measure: Total Ad Spend / Total Clicks.
3. Cost Per Mille (CPM):
- Definition: The cost to show your ad to 1,000 people.
- Why It Matters: CPM tells you how expensive your target audience is to reach. A sudden spike can indicate audience saturation or increased competition.
- How to Measure: (Total Ad Spend / Total Impressions) x 1,000.
Audience Metrics
These metrics tell you if you're talking to the right people.
4. Frequency:
- Definition: The average number of times each person has seen your ad.
- Why It Matters: This is your ad fatigue meter. If frequency gets too high (e.g., above 5-7 in a week for a prospecting audience), performance will likely drop.
- How to Measure: Total Impressions / Reach.
5. Reach:
- Definition: The total number of unique people who saw your ad.
- Why It Matters: It tells you the size of the audience you've successfully reached. If reach plateaus but spend continues, you've likely saturated your audience.
- How to Measure: Provided directly in your ad platform's reporting.
Conversion Metrics
These metrics tell you if your ads are driving action.
6. Conversion Rate (CVR):
- Definition: The percentage of people who clicked your ad and completed a desired action (e.g., a purchase).
- Why It Matters: It tells you how effective your landing page and offer are. A good e-commerce CVR is typically 1-3%.
- How to Measure: (Total Conversions / Total Clicks) x 100.
7. Cost Per Acquisition (CPA):
- Definition: The average cost to acquire one customer.
- Why It Matters: This is your budget reality check. If your CPA is higher than your profit per sale, you're losing money.
- How to Measure: Total Ad Spend / Total Conversions.
8. Return on Ad Spend (ROAS):
- Definition: The revenue generated for every dollar spent on ads.
- Why It Matters: ROAS is the king of profitability metrics. A 3x ROAS means you get $3 back for every $1 spent.
- How to Measure: Revenue from Ads / Total Ad Spend.
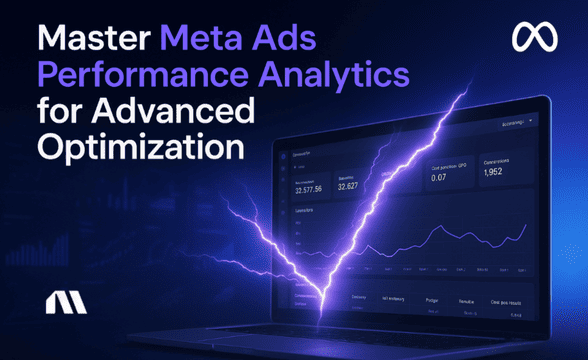
Madgicx One-Click Report — Fast Account Summaries (with blended metrics)
Need a clear snapshot of your ad performance without building custom reports? One-Click Report generates a concise, one‑page summary of your account with a single click, combining on‑platform and server‑side data into blended metrics and pulling performance across Meta, Google, TikTok, Shopify, and other channels so you see a complete cross‑channel view of reach, conversions, and revenue. Use it to spot issues quickly, compare key KPIs, and hand a ready-made summary to stakeholders.
Start the free Madgicx trial today.
Advanced Guide to Marketing Attribution Models
What is attribution? It's how you give credit for a conversion. If a customer sees a Facebook ad, clicks a Google search ad, and then buys from an email, who gets the credit? The answer depends on your attribution model.
Common (But Flawed) Models
- Last-Touch: Gives 100% credit to the last touchpoint. Simple but misleading, as it ignores the rest of the journey.
- First-Touch: Gives 100% credit to the first touchpoint. Good for measuring awareness but ignores what closed the deal.
- Linear: Divides credit equally among all touchpoints. Fair, but assumes every touchpoint is equally important, which is rarely true.
Advanced Models for 2026
- Time-Decay: Gives more credit to touchpoints closer to the conversion.
- U-Shaped (Position-Based): Gives 40% credit to the first touch, 40% to the last touch, and the rest to the middle.
- Shapley Value (Data-Driven): The holy grail. It uses AI to analyze all paths and determine the actual contribution of each touchpoint, providing a highly accurate view of your campaign performance analytics.
- Incrementality: A testing method that answers: "Would this conversion have happened anyway?" It measures the true lift your ads provide.
| If Your Customer Journey Is... |
Consider Using This Model... |
| Short and simple (e.g., impulse buys) |
Last-Touch or Time-Decay |
| Long and complex (e.g., high-ticket items) |
U-Shaped or Shapley Value |
| Focused on lead generation |
First-Touch or U-Shaped |
| You want the most accurate possible view |
Shapley Value or Incrementality Testing |
Pro Tip: iOS updates made attribution a nightmare. Madgicx's Server-Side Tracking improves accuracy by using a direct server-to-server connection (via Meta's Conversions API), giving you a clearer picture of what's working.
Building a Privacy-First Analytics Strategy for 2026
The cookie is crumbling. The smart move is to lean into privacy. Build a strategy that respects users while still giving you the data you need to grow.
- Prioritize First-Party Data: This is data you collect directly—email sign-ups, on-site behavior, purchase history. It's your most valuable and reliable data.
- Implement Server-Side Tracking: Instead of a browser pixel that can be blocked, server-side tracking sends data directly from your server to platforms like Facebook. It's a cornerstone of modern Facebook ads analytics.
- Be Transparent: Your privacy policy should be clear and upfront about what data you collect and why. Trust is a currency.
Simple GDPR/CCPA Compliance Checklist:
✅ Do you have a clear and accessible privacy policy?
✅ Do you have a cookie consent banner on your website?
✅ Is it easy for users to request or delete their data?
✅ Are you only collecting the data you absolutely need?
Digital Marketing Analytics Tools: The 2026 Tech Stack
Choosing the right tools can make or break your strategy. Here's a look at the landscape.
| Tool |
Use Case |
Key Differentiator |
Best For |
| Madgicx |
AI-powered Meta ad optimization & cross-channel analytics |
Conversational AI (AI Chat) for rapid diagnostics & AI Marketer for automated recommendations. |
Performance marketers & e-commerce brands needing to scale profitably. |
| Google Analytics 4 |
Website & app behavior analysis |
Free and deeply integrated with the Google ecosystem. |
Everyone. It's the foundational layer for on-site behavior. |
| HubSpot |
All-in-one CRM & marketing platform |
Combines marketing, sales, and service data for a full customer lifecycle view. |
B2B companies and businesses with long sales cycles. |
| AgencyAnalytics |
Client reporting and dashboards |
White-label reports and integrations with 75+ platforms. |
Agencies managing multiple client accounts. |
While many platforms present data, Madgicx is designed to provide answers. Our AI-first approach turns complex advertising data into clear, actionable recommendations.
Frequently Asked Questions (FAQ)
1. What are the most important digital marketing analytics metrics?
For e-commerce, the "big three" are Return on Ad Spend (ROAS), Cost Per Acquisition (CPA), and Conversion Rate (CVR). These metrics directly tie your advertising efforts to profitability.
2. What is the difference between web analytics and digital marketing analytics?
Web analytics (like Google Analytics) focuses on what happens on your website. Digital marketing analytics is broader, incorporating data from all your marketing channels (social media ads, email, search ads) for a complete performance view.
3. How do you measure marketing ROI accurately?
For ad campaigns, ROAS is a direct measure. For improved accuracy, you need robust tracking (like the Meta Pixel + CAPI) and an advanced attribution model (like data-driven or time-decay) that correctly assigns value across the customer journey.
4. What tools are best for digital marketing analytics?
The best stack usually includes a foundational tool like Google Analytics 4 combined with a specialized ad tech platform for data analytics like Madgicx that can aggregate cross-channel ad data and provide optimization intelligence.
5. How does AI change marketing analytics?
AI is a game-changer. Instead of just presenting data, AI can analyze it for you. It identifies trends, diagnoses problems, and provides actionable recommendations. For example, Madgicx's AI can audit your Meta account 24/7 and suggest which ad sets to scale or pause.
Conclusion: Your Next Step to Data-Driven Growth
You made it! If you remember nothing else, remember these three things:
- The ACTION Framework is your roadmap to turn data chaos into a repeatable process for growth.
- Advanced attribution is no longer optional. You must understand the full customer journey to make smart decisions.
- A privacy-first approach is the only way forward. Embrace first-party data and server-side tracking.
Your next step is simple: audit your current tracking setup using the checklist from this guide. Fixing your data foundation is the most important thing you can do today.
When you're ready to get answers quickly from your data, Madgicx's AI is here to help. Start your journey to becoming a data-driven powerhouse today. 🚀


.avif)