$99.85
Average order value
Median account AOV · USD
$30.35 to $330.34Middle 50% of account AOVs
Snapshot read 2026-10-11Scope & method

Madgicx Research & Labs
Median account AOV: $99.85 USD.
Median account AOV · USD
Enter your average order value to see where it sits.
Within Automotive Parts & Accessories
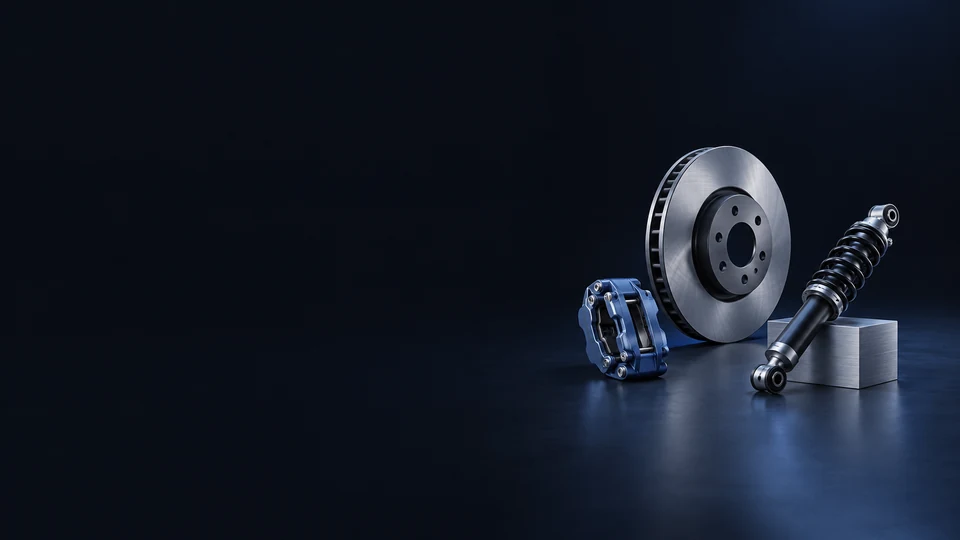
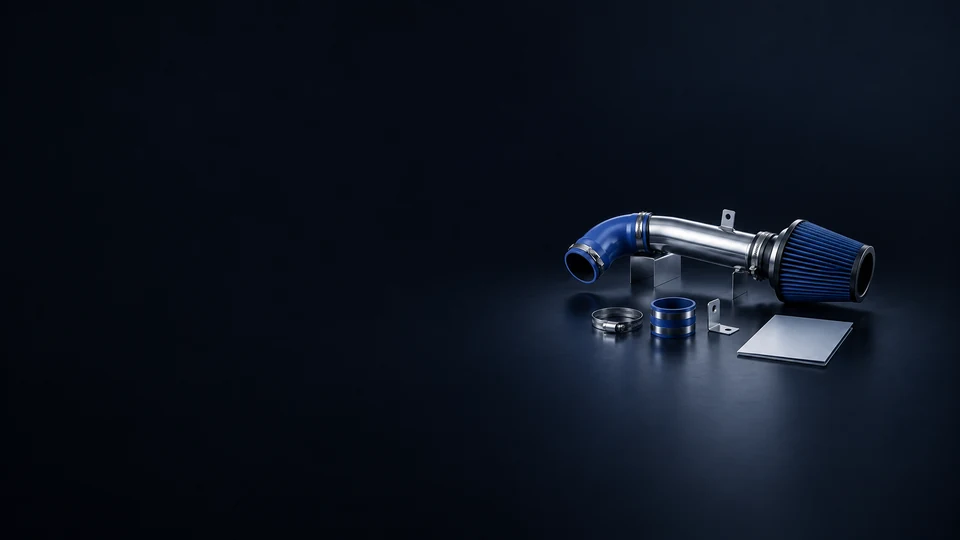
For a part whose application varies by vehicle, confirm the exact product's fitment data before writing a fit claim. Ask the shopper for the vehicle information the product requires, then show the selected application on the destination page. A year, make and model lookup is a starting point; any additional qualifier in the product record must remain visible. This is a creative qualification step, not a predicted campaign result.
Route the ad according to the decision the shopper still has to make. If the advertised part depends on vehicle application, land on the exact verified application or a selector that asks for it. If the decision depends on product attributes or kit contents, land on the corresponding specification and contents. Check the actual SKU data first; catalog standards provide fields for these facts but do not fill them in for you.
The median account AOV for Automotive Parts & Accessories is $99.85 USD. This is the middle account-level average order value in the benchmark.
USD · Equal-weight AOV benchmark. Snapshot read 11 October 2026.
The middle 50% of account AOVs runs from $30.35 to $330.34 USD. This is the interquartile range, not the minimum and maximum.
USD · Equal-weight AOV benchmark. Snapshot read 11 October 2026.
The 25th-percentile account AOV is $30.35 USD. It marks the lower edge of the middle 50% of this distribution.
USD · Equal-weight AOV benchmark. Snapshot read 11 October 2026.
The 75th-percentile account AOV is $330.34 USD. It marks the upper edge of the middle 50%, not a performance target.
USD · Equal-weight AOV benchmark. Snapshot read 11 October 2026.
Median and middle 50% of observed account-level average order values in USD, with each account weighted equally. Use this range as a comparison, not a profitability measure.
USD · Equal-weight AOV benchmark. Snapshot read 11 October 2026.
No. It is the median of account-level average order values. Each account receives equal weight; it is not a pooled average of every order.
USD · Equal-weight AOV benchmark. Snapshot read 11 October 2026.
The snapshot was read on 11 October 2026.
USD · Equal-weight AOV benchmark. Snapshot read 11 October 2026.
This benchmark covers Automotive Parts & Accessories classifications at the industry root and its subcategories. It is an aggregated advertising-data benchmark, not a census of all businesses.
USD · Equal-weight AOV benchmark. Snapshot read 11 October 2026.
Enter your AOV in USD in the comparison field above. It shows the difference from the median and whether your value falls below, within or above the middle 50%. Your entered amount stays on this page.
USD · Equal-weight AOV benchmark. Snapshot read 11 October 2026.
The comparison describes position in the account AOV distribution, not profitability. It is not a performance score.
USD · Equal-weight AOV benchmark. Snapshot read 11 October 2026.
The exports section provides this edition in Markdown and JSON, along with a research index. Credit Madgicx Research & Labs and link to the exact source. Keep its snapshot date and scope.
Credit Madgicx Research & Labs and link to the exact source. Keep its snapshot date and scope.
Keep exploring
Behind the numbers
Equal-weight AOV benchmark
Median and middle 50% of observed account-level average order values in USD, with each account weighted equally. Use this range as a comparison, not a profitability measure.
Individually authored category research. The public brand directory is not yet available. Taxonomy membership does not establish benchmark coverage.
Credit Madgicx Research & Labs and link to the exact source. Keep its snapshot date and scope.